Q&A: The importance of remaining invested based on the appropriate risk profile and policy
The previous year has come to a close, and with it comes reflection on what 2018 brought. However, a look forward to 2019 can also have its advantages.

That also applies to what important steps to follow when deciding on what investments to make in the coming year. The following is a Q&A with BBVA Compass’s Chief of Equity and Alternative Investments Anne-Joëlle Viguier-Galley, who is also Chief Investment Strategist for BBVA Wealth Solutions, Inc., the bank’s investment advisor affiliate.
In the following section, Viguier-Galley discusses staying “sane” through the investment process, equity premium, and the calculations of volatility when it comes to risk.
1) Why is risk so important?
If you lose 50% of your money, you have to make 100% to come back and break-even; it is mathematical (see Figure 1 below). The more money you lose, the harder it is to regain the losses. High volatility results in a portfolio that is more difficult to manage.

2) What is volatility and how is it calculated?
Volatility is a measure of risk. In the simplest sense, stock market volatility (or "vol" in Wall Street jargon) measures fluctuations in stock prices. Standard deviation is a statistical term that measures the amount of variability or dispersion around an average. Standard deviation is also a measure of volatility. Generally speaking, dispersion is the difference between the actual value and the average value. The larger this dispersion or variability is, the higher the standard deviation. The smaller this dispersion or variability is, the lower the standard deviation.
3) Why is volatility always here?
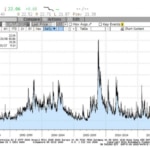
The high volatility of stock returns is common knowledge; just look at the graph below. We purposely graphed all the way back to the 1990s to remind our readers that markets are always volatile, albeit sometimes with long exceptions (like 2017). The decline in the 2H of 2018 and the accompanying higher volatility reflect concerns about a deterioration in growth when liquidity is becoming more scarce and policy more restrictive after years of QE. Financial conditions have tightened meaningfully, and there is a long list of uncertainties including slowing growth in China and Globally, trade wars, geopolitical tensions, etc.
4) What is equity premium?
Simply put, it is the “extra” return you receive for taking the “extra” risk of stocks vs. a one-month US Treasury Bill, considered risk free. The extra return always comes at a cost, though sometimes you pay in arrears.
A study by Fama and French* over the period 1963-2016 shows that the monthly equity premium of US common stocks (the Market)** was 0.51% (6% annualized); this sounds good, nonetheless, driven by volatility in the Market return, the standard deviation of the monthly equity premium was 4.42%, almost nine times larger! However, most of the evidence about the evolution of premium distributions for longer return horizons is good: i.e. as the return horizon increases, premium distributions become more dispersed, but they move to the right (towards higher values) faster than they become more dispersed (see graph E 20 years’ horizon vs. Graph A 1-year horizon below).
The percentage of negative equity premiums falls from 41.28% for the monthly returns of 1963 2016 to 4.08% for 30‐year returns***.

5) So, how do you remain invested and “sane”?
When you set your level of risk tolerance, think of the worst day in the market that you have experienced and how that makes you feel. Risk tolerance always looks better on good days and amplifies for the worst on bad days!
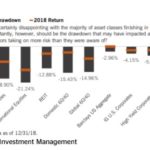
Think of your portfolio as a basket of companies, not prices and returns. We focus on quality, on franchises with high barriers to entry, free cash flow and dividend growing companies. We emphasize the importance of managing risk to the downside, and we also focus on asset allocation. Asset allocation relies on the concept that different asset classes offer returns that are not perfectly correlated (i.e. they don’t move in tandem). Unfortunately, this did not work out too well last year (see graph below), yet in 2010, Roger G. Ibbotson and colleagues**** studied 10 years of returns 5 for more than 5000 mutual funds in order to measure the relative importance of asset allocation policy vs. active management. Taken together, market return and asset allocation policy return in excess of market return dominate active portfolio management and are collectively the dominant determinant of total return variations. What is the takeaway? It is important to “be” in the market and “doing” a strategic asset allocation that you can live with, even when volatility returns to being what it has always been.
For more information on the investment products and services available through the bank and its affiliates, click here.
*Financial Analyst Journal. CFA Institute 3Q2018 (Volatility Lessons)
**The monthly equity premium is the difference between the monthly return on the value-weighted portfolio of NYSE/AMEX/NASDAQ stocks (Market) and the one-month Treasury Bill rate.
***These probabilities are from simulations that use known expected premium (realized monthly returns of 1963-2016) to construct long horizon returns. As we do not know the true expected equity premium, the added source of return uncertainty increases the dispersion of premiums.
****James X Siong, CFA, Thomas M. Idzorek, CFA and Peng Chen, CFA
*****“The equal importance of Asset allocation and Active Management” – http://cfa.is/xhl1ZR. portfolio’s total return can be decomposed into three components: (1) the market return, (2) the asset allocation policy return in excess of the market return, and (3) the return from active portfolio management (see, e.g., Bailey, Richards, and Tierney 2007; Solnik and McLeavey 2003). The “total return” of the portfolio or fund is the return net of all expenses and fees. Our measure of the “market return” is the equally weighted return for a given period for all the funds in the applicable universe. The “asset allocation policy return” refers to the static asset allocation (beta) return of the fund; intuitively, the asset allocation policy return in excess of the market return is the static asset allocation (beta) return less the market return. The “active portfolio management return” refers to the remaining returns from security selection, tactical asset allocation, and fees.
Important Disclosures: The information contained herein is provided for general informational and illustrative purposes only and should not be considered investment advice. Neither BBVA Wealth Solutions, Inc. nor any of its affiliates are providing tax, legal or accounting advice. Please consult your individual tax, legal or accounting professional for advice regarding your particular circumstances.
Advisory services provided by BBVA Wealth Solutions, Inc., a registered investment advisor and affiliate of Compass Bank. Securities offered through BBVA Compass Investment Solutions, a division of BBVA Securities Inc., member FINRA and SPIC and an affiliate of Compass Bank and BBVA Wealth Solutions, Inc. Securities and investment products:
-
Are NOT FDIC Insured
-
Are NOT deposits
-
Are NOT bank guaranteed
-
Are NOT insured by any federal government agency
-
May LOSE value