Banking 24 Jul 2017
Infographics: 5 keys to understanding a bank's results
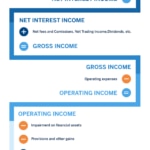
The week of the publication of second quarter 2017 results (2T 2017) begins and as it does, we remember the five keys to understanding a bank´s results. The following infographic shows how to interpret the most important figures.

The publication of BBVA’s second-quarter results for this year will take place at the close of market in Spain on July 27. At 18:00 CET, Carlos Vila Torres, CEO of BBVA, and Jaime Sáenz de Tejada, CFO, will present the results in an audio-webcast format to analysts and investors. Immediately afterwards, the CEO will present the results live to the press, also via audio-webcast. As usual, the results information will be available on this website.