How to read a bank’s balance sheet
A bank balance sheet is a key way to draw conclusions regarding a bank’s business and the resources used to be able to finance lending. The volume of business of a bank is included in its balance sheet for both assets (lending) and liabilities (customer deposits or other financial instruments).

The three crucial elements in all financial analyses include:
- Liquidity: ability to meet the obligations of liquid funds.
- Solvency: credit quality and adequacy of the bank’s own resources (indebtedness).
- Profitability: ability to generate income/profit from allocated capital.
These elements have some peculiarities when applied to a financial institution given the uniqueness of the banking business.
Liquidity is usually measured as a company’s ability to pay off debts as they come due, but this does not make sense for a credit institutions as the banking business is illiquid by definition (liabilities coming due and long-term assets).
The special characteristics of banking assets and liabilities, largely financial instruments, and the large impact of default alter the traditional approach to solvency. The regulator sets solvency ratios mainly based on the quality of the bank’s own funds and also on leverage to a lesser degree.
Profitability in a credit institution is directly related to “time” and “risk”, factors that significantly affect liquidity and solvency. The risk-return trade-off is key in the banking business.
The information included in a credit institution’s balance sheet makes it possible to analyze its investment and financing structure, in both absolute values and percentages. This allows us to compare different items relevant to the assets (trading portfolio, lending, etc.) with the total assets; selected items from the liabilities (deposits, securities issued, interbank loans received) and their evolution over time or in comparison with another institution or sector average.
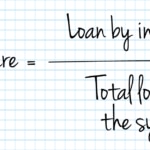
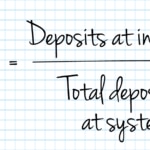
However, unlike non-financial companies, using traditional accounting analysis techniques for a bank balance sheet has the limitation of not being able to calculate the ratios used by the regulator to monitor a bank’s solvency, leverage, indebtedness, etc. from outside the bank using the information contained in the annual accounts. The nominator and denominator of these ratios include adjustments on items in the financial statements that can only be made with internal information.
A bank's activity is in its balance sheet
In a non-financial company, the sale of merchandise, billing for the provision of services or purchases made represent the volume of business in the year covered by the income statement. A bank’s activity, on the other hand, is included in its balance sheet as a variation in the volume of lending, in the assets, and comparing this with the variation of customer deposits or other financing instruments on the liabilities side. In retail banks, these two items represent the vast majority of their total assets and of the sum of equity and liabilities
By analyzing a balance sheet, conclusions can be drawn regarding a bank’s increase or decrease in activity and the resources employed to finance lending.
The income statement shows the financial margin or net interest margin. This margin is the derivative of activity from using funds from spending units that are capable of financing to grant loans to those in need of financing. Its value is equivalent to the difference between the products and financial costs, and institutions’ strategy is to obtain the lowest cost for others’ money and the highest income from funds lent to third parties.
The sum of the net interest margin plus the commissions for services provided is called core revenue. The fundamental difference between income from the banking business and those from providing services to clientele is that the latter do not directly affect the institution’s equity, as they are carried out by others, while the bank takes on risks (for its capital and others’ capital) for financial intermediation. Some authors feel it is appropriate to introduce loan loss provisions in the net interest margin, as provisions for non-performing or questionable loans means lower returns from lending.
It remains to be seen how the enormous changes taking place in the banking industry, and those that are yet to come, will impact the importance of these two items on the balance sheet (lending and customer deposits).
On September 13, 2016, at the presentation of the Financial Studies Foundation’s (FEF) study “Banks’ changing business model”, BBVA Research’s Ana Rubio González affirmed that credit will no longer be the driver of banks’ income, meaning that institutions “should no longer be so focused on growing and expanding their balance sheets, but on providing services that use little capital - more in line with what U.S. institutions have been doing.”
And who will take on the role of intermediation between savings and productive investment? It is now a reality that the largest European companies are replacing traditional financing from bank loans by issuing debt securities in capital markets.
Market share
We analyze the market share controlled by the analyzed institution, as well as its development over time, the degree of relative concentration in the sector and the eventual dominant positions.


Default
The concept of “default” refers to the failure to meet the interest and capital payment obligations corresponding to their loans or credits.
The non-performance loan ratio indicates what percentage of loans that are at risk of failing. The comparison of provisions for insolvency against the total amount of loans granted gives an idea of the possible coverage of future contingencies.
Some of the most-used ratios to measure non-performance are:
- Non-performing loans / Customer loans
- Non-performing loans / (Customer loans + collaterals)
- Provisions / Average total assets
In particular, the ratio: (NPL Portfolio / Total Assets) is especially relevant in troubled institutions and, when it exceeds certain levels it is usually taken as an indication of an institutions insolvency.
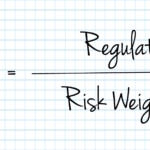
A lending institution’s solvency depends on the existence of a buffer of own resources that is sufficient to absorb losses and guarantee the risks assumed in its lending transactions. Thus, the solvency ratio - or capital ratio – allows comparing an institution’s resources, which are regulated and defined in effective regulations, and its risk-weighted assets.
The lower the percentage of own resources compared to the total of the balance sheet, the higher the institution’s financial leveraging and the lower the level of protection of the institution against defaults in the loans stated in the assets side.

The regulatory capital is established at different levels: Common Equity Tier 1 or CET 1, TIER 1 Capital, TIER 2 Capital and the summation of TIER 1 and TIER 2 capital, called Capital Base or Core Capital.
The new regulations resulting from Basel III require institutions to increase both the volume and the quality of their capital reserves, increase capital deductions and revise the requirements associated to certain assets. Unlike the previous framework, the minimal capital requirements are complemented with capital buffer requirements as well as with liquidity and leveraging related requirements.
To this regard, it establishes that credit institutions must keep at all times, both at individual and consolidated level, a total capital ratio of 8% of its risk-weighted assets (Pillar 1 requirement). At least 6% of the total capital ratio will need to be made up by Tier 1 capital, of which 4.5% will need to be made up in any case by CET1 capital. The remaining 2% may be completed with Tier 2 capital instruments.
Regardless of the application of the Pillar 1 requirement, according to CRD IV, competent authorities could require credit institutions to keep equity in excess of the Pillar 1 requirements to cover additional risks other than those already covered by the Pillar 1 requirement (this power of the competent authority is commonly known as Pillar 2).
Additionally, from January 1, 2016, in compliance with CRD IV, credit institutions are required to meet at all times the combined requirement of capital buffers, which must be satisfied with CET1 on top of the capital allocated to meet Pillar 1 and Pillar 2 requirements.
The combined capital buffer requirement consists of:
- A capital conservation buffer
- A specific countercyclical capital buffer
- A buffer for global systemically important banks (G-SIB buffer)
- Abuffer for other systemically important banks (the “D-SIB buffer”)
- Asystemic risk buffer.
The combination of:
- Capital preservation buffer;
- the specific countercyclical capital buffer; and
- the highest between
- the systemic risk buffer;
- the G-SIB buffer; and
- the D-SIB buffer, (in each case, as applicable to each institution),
comprise the combined capital buffer requirement of an institution.